

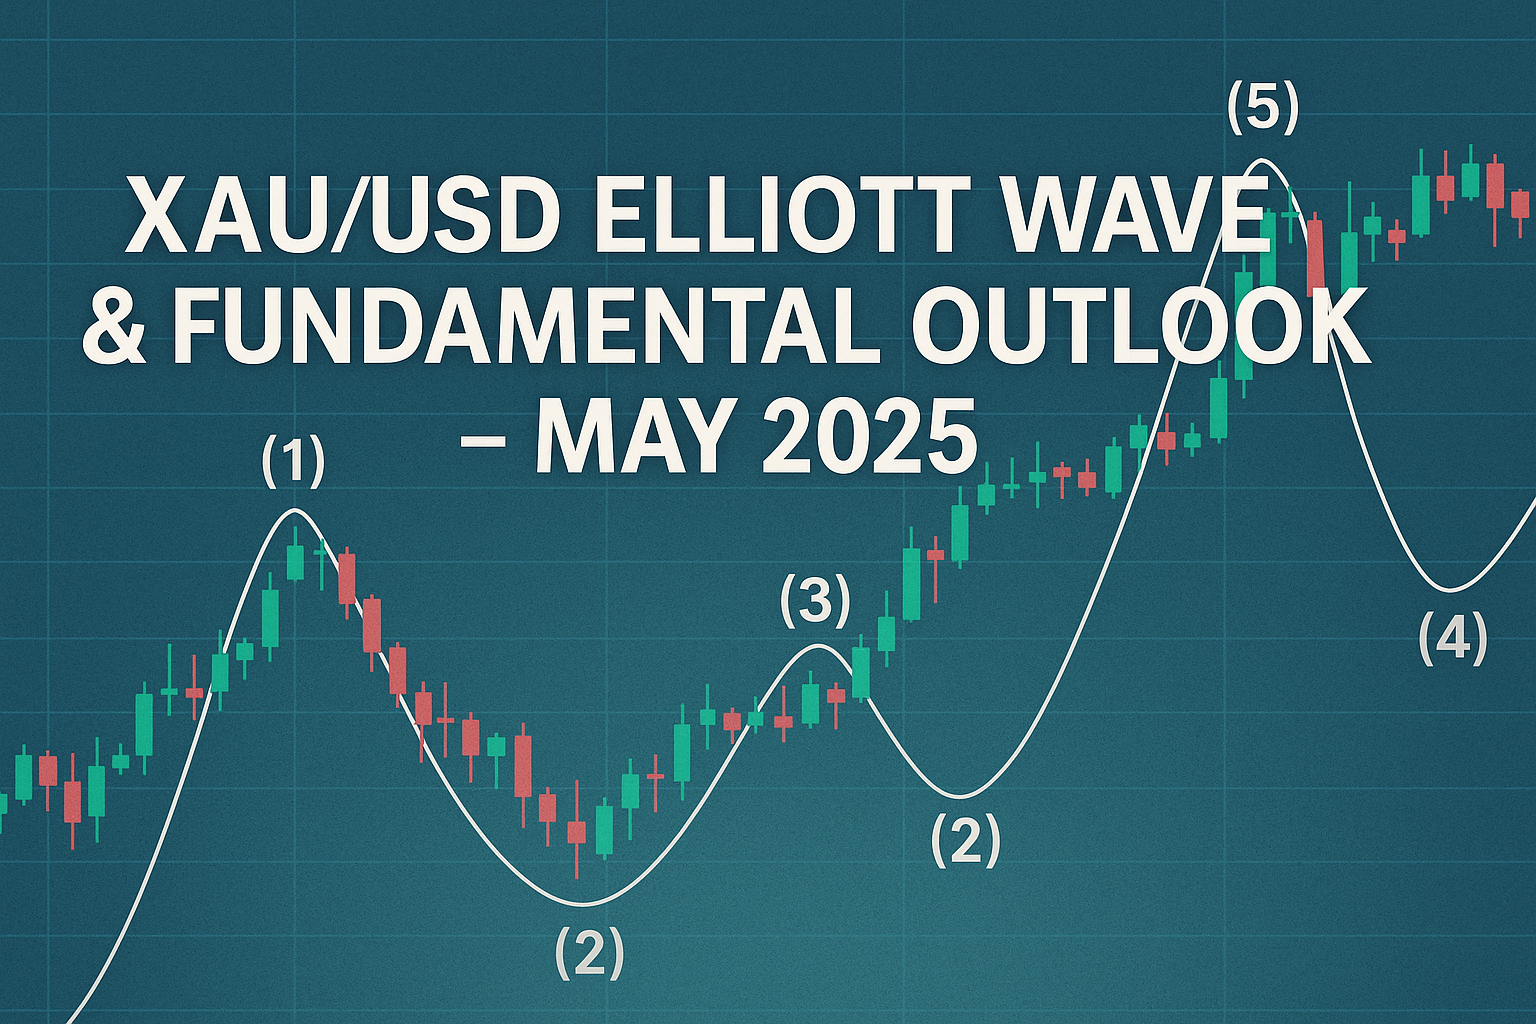
Elliott Wave Analysis: XAU/USD Daily Chart
Gold (XAU/USD) has been exhibiting a complex Elliott Wave structure on the daily timeframe. After peaking at approximately $3,500 in April, the market appears to be undergoing a corrective phase.
- Wave (1): Initiated the bullish trend from the $2,800 region.
- Wave (2): A corrective pullback, retracing to around $3,100.
- Wave (3): Extended rally reaching the $3,500 area.
- Wave (4): Current correction, potentially targeting the $3,200–$3,000 support zone.
- Wave (5): Anticipated to resume the uptrend, possibly challenging the $3,700–$3,800 levels by late May.
This analysis suggests that the ongoing correction could provide a buying opportunity before the next impulsive wave commences.
Fundamental Drivers Supporting Gold’s Rally
Several macroeconomic factors are underpinning gold’s strength:
- Recession Fears: Goldman Sachs forecasts gold prices potentially surpassing $3,700, possibly reaching $4,800 by mid-2026, as investors seek safe-haven assets amid increasing U.S. recession risks. (Business Insider)
- Central Bank Purchases: Billionaire investor John Paulson predicts gold could approach $5,000 by 2028, citing central bank buying and global trade tensions as key drivers. (Reuters)
- Geopolitical Tensions: U.S. President Donald Trump’s tariff policies have heightened economic uncertainty, prompting investors to flock to gold as a safe haven. (AP News)
- Physical Demand: The World Gold Council reports that total gold demand in Q1 2025 nearly matched the Q4 record, with a 40% year-over-year rise in value due to surging prices. (World Gold Council)


